| Quick tutorial | ||||||
| System Requirements | ||||||
| Description of interface | ||||||
| Input data | ||||||
| Connection to a database | ||||||
| Query forms to add/filter/color a graph | ||||||
| Add Interactions | ||||||
| Expand nodes | ||||||
| Filter a graph | ||||||
| Color a graph | ||||||
| Layout a graph | ||||||
| Node and edge information | ||||||
| Save options | ||||||
| Deployment | ||||||
Color graph
|
![]()
Center for Molecular Medicine and Genetics
Wayne State University School of Medicine
540 E. Canfield
Detroit, MI 48201
![]()
| IM Browser Manual |
|
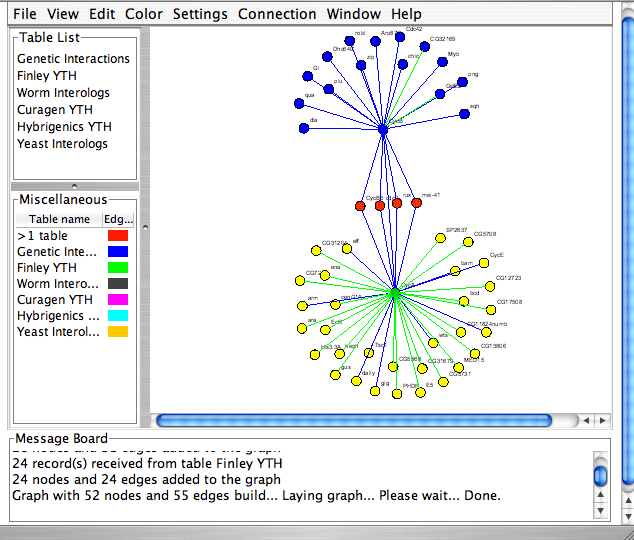
Description of the interface Image below shows a typical screen shot of the IM Browser window. The window is divided into four panels. The top left panel shows the list of interaction tables for the current database connection, the bottom left panel provides a key to the current coloring scheme, the right panel shows the interaction map, and the bottom panel is a message board showing the results of recent manipulations. The messages in the board will give you a clue what the application is currently doing.
|

